
ALPW in AWIPS via SBN
April 30th, 2025 by Jorel TorresAs of Spring 2025, the Advected Layer Precipitable Water (ALPW) product became more widely available for NOAA National Weather Service (NWS) forecasters to access and utilize in the Advanced Weather Interactive Processing System – II (AWIPS-II) via Satellite Broadcast Network (SBN). Within the AWIPS interface and menu, forecasters can click on the ‘Satellite’ tab, scroll down to ‘Polar Derived Products Imagery’, then click on ‘Advected Layered Precip Water (ALPW)’ and select one of the following precipitable water layers: surface to 850 hPa, 850 to 700 hPa, 700 to 500 hPa, and 500 to 300 hPa. Note, hectopascals (hPa) are equivalent to millibars (mb) with respect to units of pressure. Refer to the screenshot of the AWIPS menu below.
AWIPS Satellite Submenu to Access ALPW

Forecasters are encouraged to display the ALPW product in AWIPS-II via 4-panel layout to track the moisture plumes horizontally while identifying the vertical distribution of the moisture. The ALPW 4-panel animation below shows the surface to 850mb (top-left), 850-700mb (top-right), 700-500mb (bottom-left) and the 500-300mb (bottom-right) precipitable water layers from 29-30 April 2025. The animation highlights the rich, low level moisture (i.e., surface to 700mb) that migrates from the Gulf into the southern U.S. Within the 700-500mb layer, an upper level low can be identified spinning over the desert southwest, while on the southeast side of the low, an upper-level moisture plume advects to the northeast into the southern states. Sources of the upper-level moisture come from the East Pacific and northern Mexico.
ALPW observations from 5Z, 29 April 2025 to 5Z, 30 April 2025
The moisture plumes aided in the development of heavy precipitation and severe weather that occurred over the region. Refer to the National Water Prediction Service (NWPS) 24-hour precipitation estimates below. Precipitation maxima can be found over southwestern Oklahoma, near the Oklahoma/Texas border.
National Water Prediction Service (NWPS): 24-hour Quantitative Precipitation Estimate (QPE)
12Z, 29 April 2025 to 12Z 30 April 2025

For users that do not have access to an AWIPS system, they can access the ALPW product online via CIRA webpages (i.e., near-real-time datasets here, via CIRA SLIDER, and archived data). The moisture product files can also be found on the AWS NOAA Open Data Dissemination (NODD) webpage. ALPW’s experimental products, Layered Vapor Transport (expressed in kg/m/s) and Percentile Rankings, can be accessed online too.
Users seeking ALPW training on its applications and utility in operations can take the product teletraining session via NOAA CLC, and/or access the session via web-based video.
Posted in: Uncategorized, | Leave a Comment
Flooding in the Mid-South
April 9th, 2025 by Jorel TorresLast week, from 2-6 April 2025, multiple rounds of precipitation and severe weather impacted the Mid-South region of the United States. The National Weather Service (NWS) Weather Prediction Center (WPC) provided an estimated precipitation map that incorporates the total rainfall that occurred over the span of 96 hours (from 8am EDT, 2 April 2025 through 8am EDT, 6 April 2025). Refer to the map below via social media. The map highlights the significant precipitation that occurred over the Mid-South, where precipitation maxima (~10 to 15 inches, expressed in the brighter magenta colors) can be seen near or within several metropolitan areas (e.g., Little Rock, AR, Memphis, TN), in addition to southeastern Missouri and the western Kentucky regions. The influx of precipitation has also led to moderate and major flood stages along rivers that are located within the region. A handful of photos and videos of the event were captured by The Weather Channel.

A 4-panel of the Advected Layer Precipitable Water (ALPW) product observed a portion of the event from 3-5 April 2025. Refer to the ALPW animation below. During this time period, the ALPW surface-850mb, and 850-700mb layers show rich, low-level moisture advecting from the Gulf into the southern U.S. Meanwhile, the ALPW 700-500mb layer (and the 500-300mb layer) observe plumes of high level moisture that originated from the Eastern Pacific, transported over Mexico and advected towards the Mid-South region, aiding in significant, widespread precipitation.
4-Panel of ALPW from ~00Z, 3 April 2025 to 00Z, 5 April 2025
A before (1 April 2025) and after (7 April 2025) image comparison of the VIIRS Flood Map product captured the flood extent over the Mid-South at 375-m spatial resolution. The daytime product shows the widespread areas of inundation (i.e., seen in light green, yellow, orange, and red pixels, and expressed in floodwater fraction percentage from 0 to 100%) over several states that include Arkansas, Tennessee, Kentucky, Missouri, Illinois, and Indiana.
VIIRS Flood Map Before/After Comparison over the Mid-South

Posted in: Uncategorized, | Comments closed
Hawaiian Winter Storm
February 5th, 2025 by Jorel TorresIn the central Pacific Ocean last week, a strong low pressure system brought heavy rain and high winds to the Hawaiian islands. Snowfall accumulations were also observed on the summits of Mauna Kea and Mauna Loa that are located on the big island of Hawai’i. Additional media coverage of the winter storm can be viewed here and here.
GOES-18 ABI 10.3um imagery captured the center of the cyclone (i.e., initially found northwest of Hawaii) and its cold front travelling east, producing multiple rounds of precipitation over the islands.
GOES 18 ABI 10.3um IR observations from 21Z, 29 January 2025 to 00Z, 1 February 2025
The Advected Layer Precipitable Water (ALPW) product (animation shown below) provides a moisture perspective of the storm. Derived from multiple polar-orbiting satellites, ALPW highlights the precipitable water values of the cyclone in 4 atmospheric layers: surface-to-850mb (top-left), 850mb-700mb (top-right), 700-500mb (bottom-left), and 500-300mb (bottom-right). Within the black boxes in the animation, note the distinct storm circulation and the water vapor transport that aided in the development of heavy precipitation over the Hawaiian islands. Observe the moisture depth of the storm too, especially from the surface to 500-mb.
ALPW observations from ~01Z to 15Z, 31 January 2025
CoCoRaHS precipitation accumulations from the storm can be seen over Hawaii from 30 January to 1 February 2025. Per NOAA/NWS Record Event Reports, Honolulu, HI, set a new record of daily maximum rainfall of 3.57 inches on 30 January 2025. The new record broke the old record of 1.22 inches set back in 1975!

NOAA-20 VIIRS Day Cloud Phase Distinction RGB imagery highlights a before (29 January 2025) and after (2 February 2025) imagery comparison of the winter storm that passed through the big island of Hawai’i. The areal extent of the new snow cover is seen in green over the higher elevations of the island. The RGB imagery exhibits a 375-m spatial resolution.
Posted in: Uncategorized, | Comments closed
Hughes Fire, California
January 24th, 2025 by Jorel TorresFires have engulfed Southern California over the past few weeks, where another fire (i.e., the Hughes Fire) erupted just northwest of the Los Angeles metropolitan area. At the time of this blog entry (~22Z, 23 January 2025), the fire had scorched 10,000+ acres in Los Angeles and Ventura counties and was 24% contained. Dangerous fire conditions still persist through 24 January 2025, with red flag warnings that forecast low relative humidities and strong, gusty winds in southern California that could lead to significant fire growth or fire initiation. More coverage of the Hughes Fire can be viewed on CNN.
Geostationary satellites captured the fire initiation (~1833Z) along with the rapid growth of the Hughes Fire. Notice how the fire pixels flare up in northwestern Los Angeles County, where the fire spreads to the south and east within a ~4 hour time frame.
GOES – 18 ABI 3.9um from 1820Z-2200Z, 22 January 2025
Between 2000Z and 2140Z, three polar-orbiters observed the Hughes Fire at a higher spatial resolution of 375-m, compared to the coarser 2-km GOES ABI 3.9um. The higher spatial resolution provides finer details of the fire perimeter and the thermal hotspots (i.e., warmer brightness temperatures).
JPSS VIIRS 3.7um (I4 Band) at 2000Z, 2120Z and 2140Z on 22 January 2025
Another way to view the Hughes Fires is by the VIIRS Day Fire RGB which is sensitive to fire hotspots, smoke, along with vegetation health and burn scars. During the same time frame (i.e., 2000Z to 2140Z), this RGB observed the active fires and corresponding smoke plume that moves to the southwest. Note, the higher level clouds (i.e., located further south) shifting to the east. Like the VIIRS 3.7um, the VIIRS Day Fire RGB also exhibits a 375-m spatial resolution.
JPSS VIIRS Day Fire RGB at 2000Z, 2120Z and 2140Z on 22 January 2025
Posted in: Fire Weather, GOES, POES, Satellites, VIIRS, | Comments closed
New Orleans Snowstorm
January 22nd, 2025 by Jorel TorresA historic winter storm impacted the southern United States, blanketing several states with multiple inches of snow, spanning from southeast Texas (i.e., Houston metro area) to Florida and the Carolinas. Numerous flights were delayed or cancelled at the Louis Armstrong New Orleans International Airport from 21-22 January 2025, where the airport accumulated 8 inches from the storm. Additional unofficial snow reports across the New Orleans metro area, that also includes neighboring parishes and counties can be accessed via National Weather Service (NWS). Photos and videos of the snowstorm in New Orleans were collected and depicted by Axios. The Weather Channel has the latest updates covering the winter storm and its impacts.
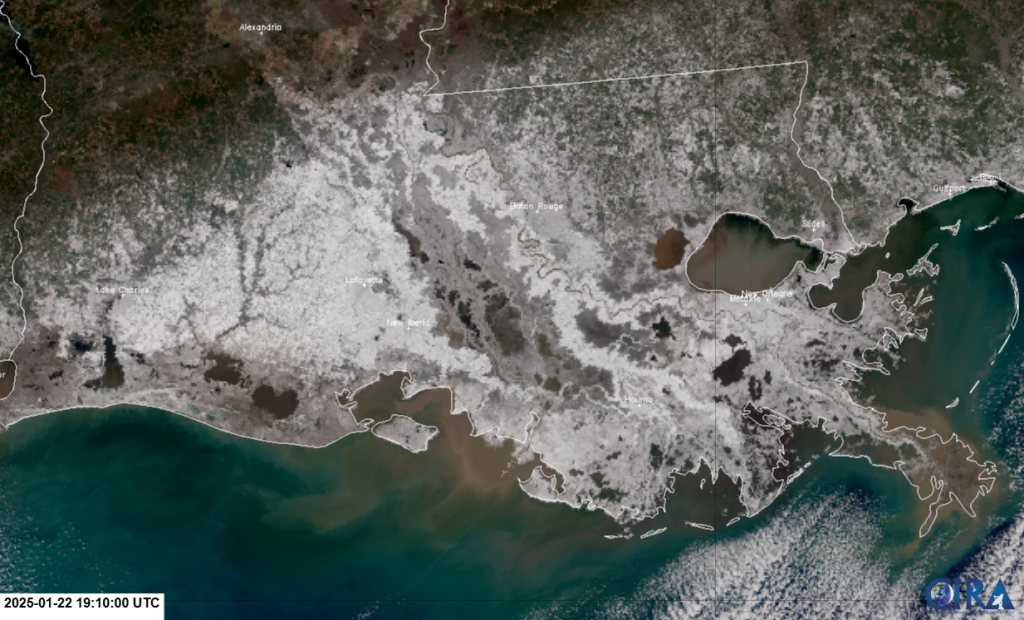
The fresh snowpack was captured by the VIIRS instrument on-board JPSS polar-orbiting satellites. The NOAA-21 VIIRS GeoColor product observed the snow cover over southern Louisiana and Mississippi at 750-m spatial resolution. Notice the sharp gradient of snow cover (seen in white) located south of Alexandria, LA, exhibiting a southwest-to-northeast orientation. Widespread snow cover can be seen near or along the coastline as well.
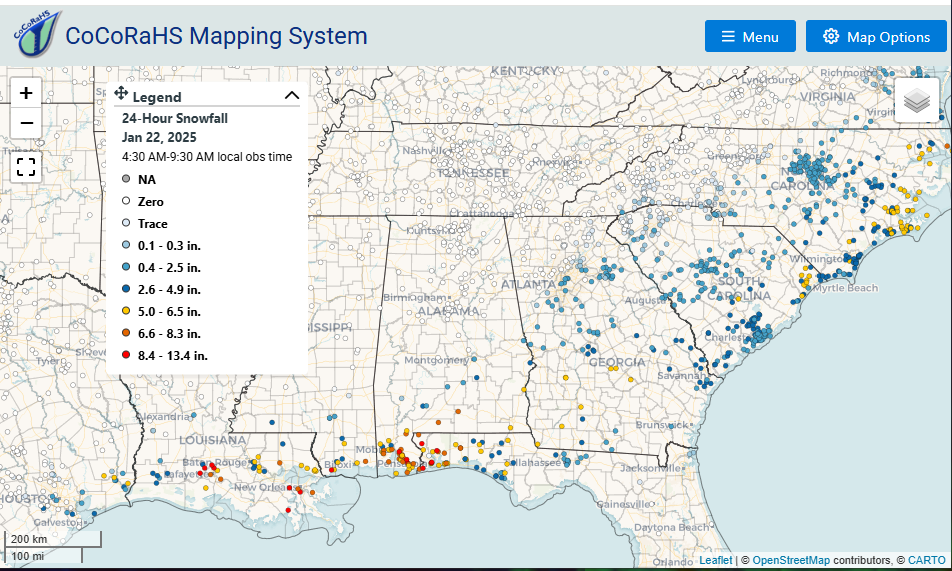
Zooming out over the southern U.S., the snow cover can be seen by multiple overpasses from the SNPP, NOAA-20, and NOAA-21 VIIRS Day Cloud Phase Distinction RGB on 22 January 2025. From this RGB, the snow cover is seen in green, extending from southeast Texas to the Carolinas. The snow cover observations seen by the imagery, express similar agreement with the CoCoRaHS 24-hour snowfall reports observed over the same domain.
Posted in: POES, Satellites, VIIRS, Winter Weather, | Comments closed